Smarter, Faster, Better
 I apologize that I have been slow with adding new blog entries over the last couple months. I've been hard at work rewriting the Investomation backend and the changes have finally been published. If you're wondering what exactly has changed, the app got better (and significantly faster) at approximating metrics at various granularities as a result of an architectural rewrite, which I'm very excited about.
The architecture has been rebuilt to use what I call a layered knowledge database, where each layer represents a dimension of analysis that the model performs. This is similar to the logic within internal layers of a neural network.

An example of a layer would be time-based interactions between metrics. Another example is a layer that tracks geospatial interactions. There are currently about half a dozen layers, and the architecture allows adding more. The model can now reason about each layer independently, which makes it less error-prone and more powerful. For example, you can now switch to tract granularity for any metric (previously many metrics would report no data at this level). The new new architecture allows the model to approximate metrics even at levels that are not publicly available by correlating it against other metrics that are available at that level. This approach is similar to the one Magnific AI uses to upsample images. We're effectively upsampling data granularity using the model's knowledge of the nearby environment, historical data, and data from other sources that has high correlation to the metric in question.

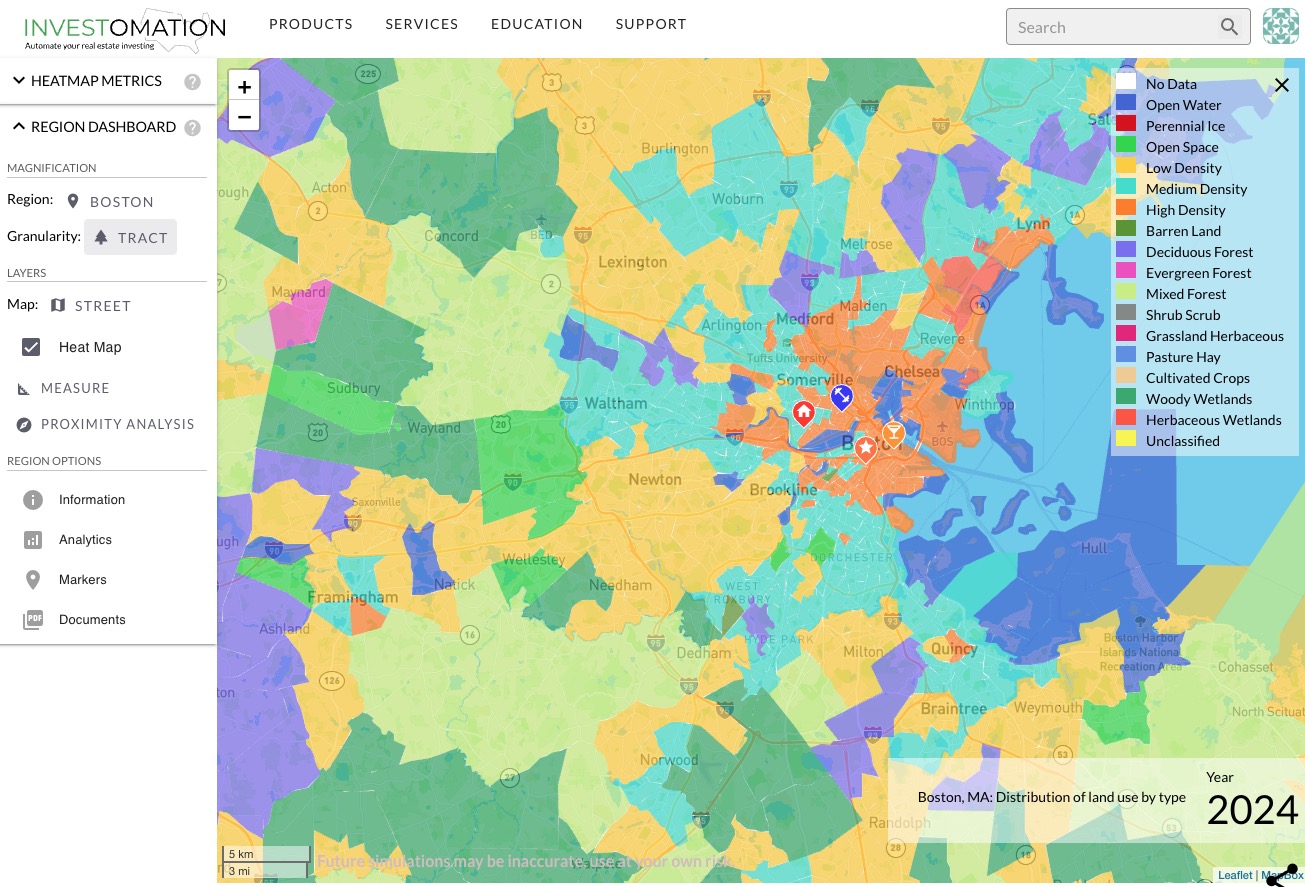
The new architecture also allows easier troubleshooting when a metric seems to provide erroneous data since our developers can now identify exactly which layer is the culprit by observing the underlying database. As an added benefit of the new architecture, the map now feels a lot more responsive. Analysis that previously could take a minute or longer now computes in seconds. Try playing with some of the metrics, for example. This architecture also made the logic more flexible, allowing me to incorporate new metrics for land use, which I will cover in another post.
The new architecture also allows incorporating new metrics into the model in a matter of hours, and I'm currently in the process of exposing that feature to our business users. For example, let's say a corporate client has a private database of property sales and operating expenses that they want to use to compute Cap Rates, but don't want to share this data with their competitors. They could upload this data to Investomation and request to train the model using this input data. Both the data and the new knowledge obtained by the model as a result would be kept private to this account, allowing them a competitive advantage and to visualize their data in a way they couldn't before just from their spreadsheet alone.
I'm also working on enhancing the approach for analyzing the metrics. Currently, the user can only stack the metrics and assign weights to them (both negative and positive). But there are times when the user may need to perform more complex arithmetic. For example, the now famous 2% rule (sometimes also called the 1% rule, since you will rarely find a 2% property nowadays) is derived by dividing monthly rent by price. Allowing users to perform mathematical operations on metrics opens up a whole new world of custom-tailored pseudo-metrics the user can define and save to favorites.